一.数据的获取 GEO数据库全称Gene Expression Omnibus database,是由美国国立生物技术信息中心NCBI创建并维护的基因表达数据库。它创建于2000年,收录了世界各国研究机构提交的高通量基因表达数据,也就是说只要是目前已经发表的论文,论文中涉及到的基因表达检测的数据都可以通过这个数据库中找到。包含了芯片和二代测序的数据。刚接触GEO肯定会发现GPL,GSM,GSE,GDS等甚至还有SRA这些标志。
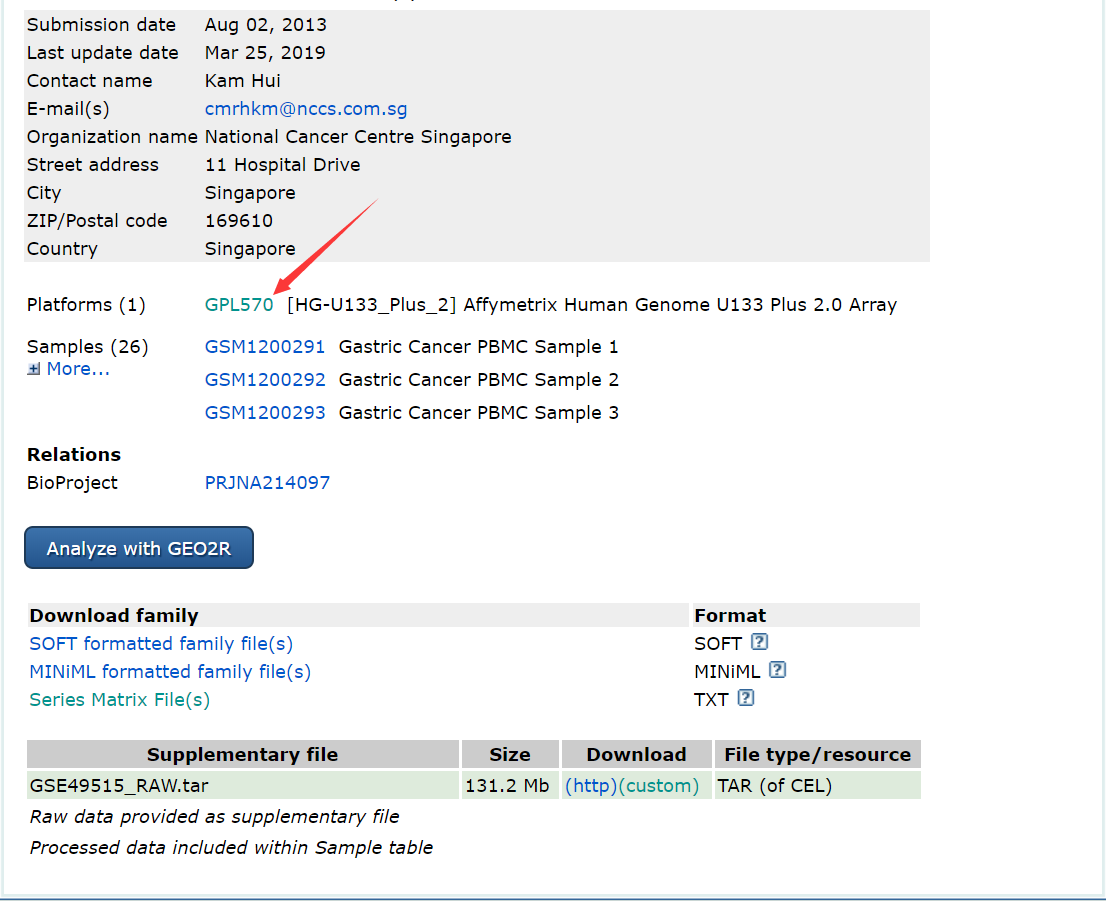
GPL就是platform,就是说实验是用什么做的,如果是芯片数据GPL一般用来将probe转换成gene ID。
GSE就是series,可以理解成是一组实验包含一些control和case的样本
GSM就是sample,样本号
GDS,是GEO工作人员根据一定的研究目的归类的dataset。
SRA就是sequence read archive,记录的是二代测序的read以及比对情况,可以通过SRA数据自己从头进行下游分析。
1.通过GEOquery下载 1 2 3 4 5 6 7 8 9 10 11 12 13 gse49515<-getGEO('gse49515' ,AnnotGPL = F ,getGPL = F ) gene_exp <- as.data.frame(exprs(gset[[1 ]])) > gene_exp[1 :3 ,1 :3 ] GSM1200291 GSM1200292 GSM1200293 1007_s_at 6.06616 6.08172 5.63387 1053_at 7.19067 7.49107 7.52000 117_at 9.01752 8.13871 8.27904 > table(is.na(gene_exp)) FALSE 1421550 sample_Info <- pData(gset[[1 ]]) gpl570<-getGEO('GPL570' )
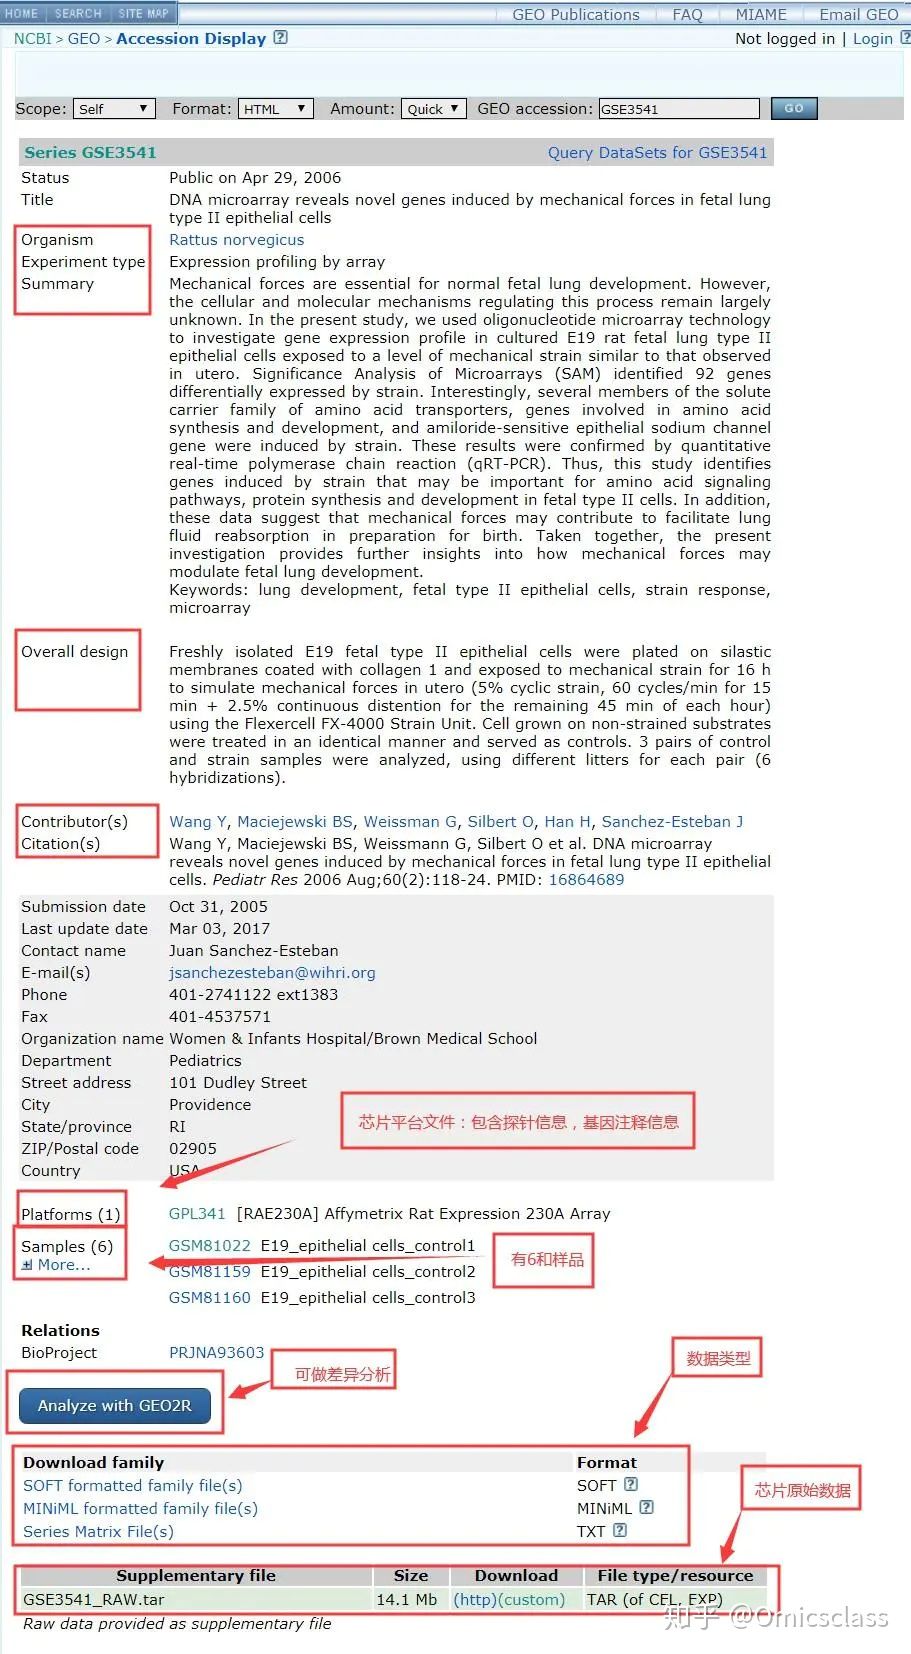
2.NCBI上下载 GEO下载页面布局如图所示
GEO数据类型:
说明:
数据类型描述数据解释(解压后可用notepad++打开)
SOFTSOFT formatted family file(s)一个压缩包一个文件;平台信息芯片中探针与基因的对应关系注释文件;样品单独的表达量
MINiMLMINiML formatted family file(s)一个压缩包多个文件分开放;平台信息芯片中探针与基因的对应关系注释文件;单个样品表达量文件
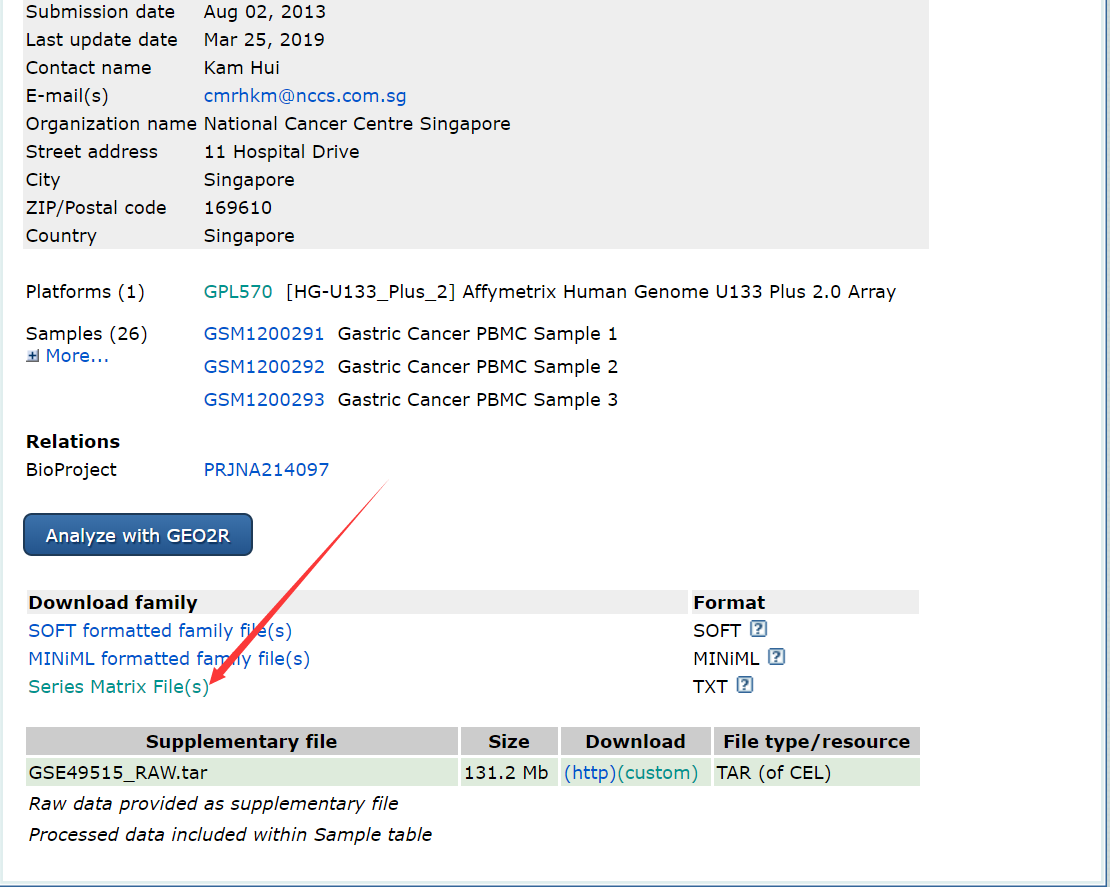
TXTSeries Matrix File(s)所有样品表达矩阵数据文件
TAR (of CEL, EXP)GSE3541_RAW.tar芯片原始数据(cel)文件
下载网址:https://www.ncbi.nlm.nih.gov/geo/query/acc.cgi
表达矩阵我们按下图下载
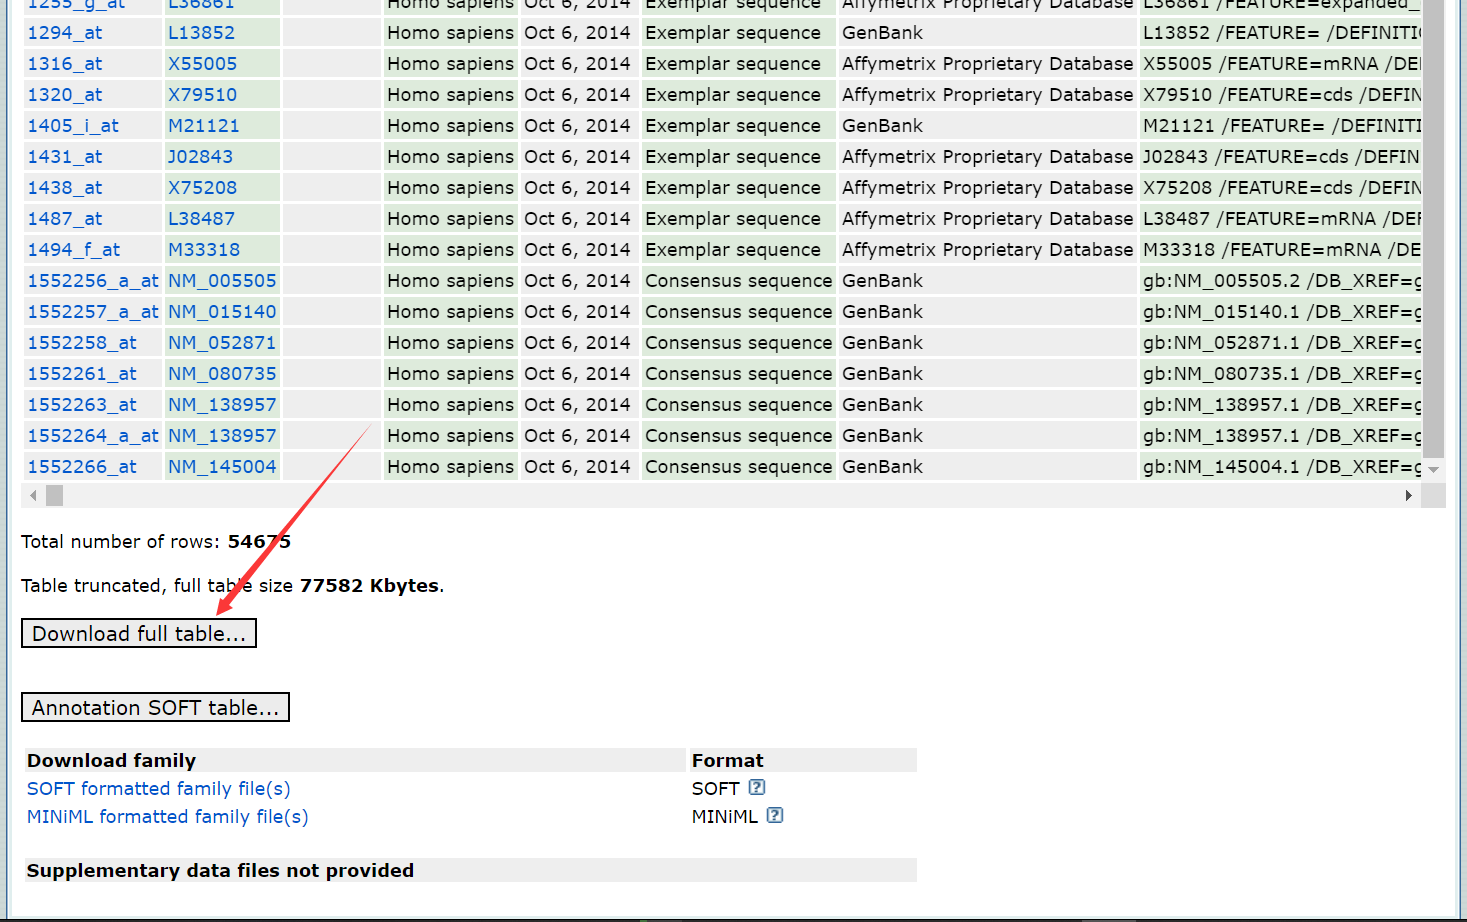
芯片平台探针信息
1 2 3 gene_exp<-read.delim('~/GEO/GSE49515_series_matrix.txt' ,comment.char = '!' ,stringsAsFactors = F ) gene_info <-read.delim('~/Downloads/GPL570-55999.txt' ,comment.char = '#' ,stringsAsFactors = F )
二.数据分析 1.ID转换 目前得到的表达矩阵,行名就是一个个probe,列名是样本。需要将probe的ID转换成gene,转换也很简单GPL文件给我们提供了这个信息,核心就是一个merge函数,一般转换成gene名。
1 2 3 4 5 6 7 8 9 10 11 12 13 14 15 16 17 18 19 20 21 22 23 24 25 gene_info <- read_delim("GPL570-55999.txt" , "\t" , escape_double = FALSE , comment = "#" , trim_ws = TRUE ) %>% dplyr::select(ID, Gene_Symbol = 'Gene Symbol' ) > head(gene_info,4 ) ID Gene_Symbol <chr> <chr> 1 1007_s_at DDR1 /// MIR46402 1053_at RFC2 3 117_at HSPA6 4 121_at PAX8 > gene_exp[1 :3 ,1 :3 ] GSM1200291 GSM1200292 GSM1200293 1007_s_at 6.06616 6.08172 5.63387 1053_at 7.19067 7.49107 7.52000 117_at 9.01752 8.13871 8.27904 gene_exp <- rownames_to_column(gene_exp,var="ID" ) > gene_exp[1 :3 ,1 :3 ] ID GSM1200291 GSM1200292 1 1007_s_at 6.06616 6.08172 2 1053_at 7.19067 7.49107 3 117_at 9.01752 8.13871 expr_id_symbol <- merge(gene_exp,gene_info,by='ID' )
1 2 3 4 5 6 7 8 9 > table(is.na(expr_id_symbol)) FALSE TRUE 1522007 8893 pos <- which(is.na(expr_id_symbol$Gene_Symbol)) expr_id_symbol <- expr_id_symbol[-pos,] > table(is.na(expr_id_symbol)) FALSE 1281896
1 2 3 4 symbol<-lapply(expr_id_symbol$Gene_Symbol, FUN = function (x){strsplit(x,'///' )[[1 ]][1 ]}) expr_id_symbol$Gene_Symbol <- as.character(symbol)
1 2 3 4 5 6 7 8 9 10 11 12 library (dplyr)data4 <- expr_id_symbol[,2 :28 ] %>% arrange(Gene_Symbol) %>% group_by(Gene_Symbol) %>% summarise_all(mean) data4 <- column_to_rownames(data4,var = 'Gene_Symbol' ) > nrow(gene_exp) [1 ] 54675 > nrow(data4) [1 ] 23348
2.数据分布 1.ggplot2绘制 1 2 3 4 5 6 7 8 9 10 11 12 13 14 15 16 17 library (reshape2)library (ggplot2)expr_li<-melt(data4) > head(expr_li) variable value 1 GSM1200291 1.727950 2 GSM1200291 4.248380 3 GSM1200291 2.745500 4 GSM1200291 2.167750 5 GSM1200291 10.649900 6 GSM1200291 2.614425 colnames(expr_li)<-c('sample' ,'value' ) group<-c(rep('GastricCancer' ,3 ),rep('HCC' ,10 ),rep('Normal' ,10 ),rep('PancreaticCancer' ,3 )) expr_li$group<-c(rep(group,each=nrow(data4))) p<-ggplot(expr_li,aes(x=sample,y=value,fill=group)) p+geom_boxplot()+theme(axis.text.x = element_text(angle=45 ,vjust=0.5 ))+theme(legend.position = 'top' )
2.基础函数绘制 1.标准化前 1 2 boxplot(data4,outline=FALSE ,las=2 )
2.标准化后 1 2 3 data4_nor <- normalizeBetweenArrays(data4) boxplot(data4_nor,outline=FALSE ,las=2 )
3.limma差异表达分析 1 2 3 4 5 6 7 8 9 10 11 12 13 14 15 16 17 library (limma)design<-model.matrix(~0 +factor(group)) colnames(design)<-levels(factor(group)) rownames(design)<-colnames(data4) con<-makeContrasts(paste('HCC' ,'Normal' ,sep='-' ),levels = design) fit<-lmFit(data4,design) fit2<-contrasts.fit(fit,con) fit3<-eBayes(fit2) tmpout<-topTable(fit3,coef = 1 ,n=Inf ) nrDEG<-na.omit(tmpout)
4.火山图绘制 1 2 3 4 5 6 7 8 9 10 11 12 13 14 15 16 17 18 19 20 res <- nrDEG data <- data.frame(gene = row.names(res), pvalue= res$adj.P.Val, log2FoldChange = res$logFC) data <- na.omit(data) data <- mutate(data, color = case_when(data$log2FoldChange > 1 & data$pvalue<0.05 ~ "Increased" , data$log2FoldChange < 1 & data$pvalue< 0.05 ~ "Decreased" , data$pvalue>0.05 ~ "nonsignificant" )) my_palette <- c('#E64B35FF' , '#4DBBD5FF' ,'#999999' ) library (ggplot2)ggplot(data = data, aes(x = log2FoldChange, y = -log10(pvalue))) + geom_point(aes(color =color, size = abs(log2FoldChange))) + geom_hline(yintercept = -log10(0.05 ), linetype = 'dashed' ) + geom_vline(xintercept = c(-1 , 1 ), linetype = 'dashed' ) + scale_color_manual(values = my_palette) + scale_size(range = c(0.1 , 3 )) + xlim(-5 ,5 )+ylim(0 ,10 )+ theme_bw()
5.热图 1 2 3 4 5 6 7 8 9 10 11 12 13 14 15 top_50_gene <-arrange(nrDEG,desc(abs(logFC)),adj.P.Val)[1 :50 ,] top_50_gene <- left_join(rownames_to_column(top_50_gene,var='ID' ), rownames_to_column(data4,var = 'ID' ),by='ID' ) top_50_gene <- top_50_gene[,-c(2 :7 )]%>%column_to_rownames(var = 'ID' ) ncol(top_50_gene) top_50_gene <- top_50_gene[,4 :23 ] anno <- as.data.frame(group[4 :23 ]) rownames(anno)=colnames(top_50_gene) pheatmap::pheatmap(top_50_gene,scale ='row' ,annotation_col = anno,show_rownames = FALSE )
6.GO和KEGG富集 1.go富集 1 2 3 4 5 6 7 8 9 10 11 12 13 14 15 16 library ('org.Hs.eg.db' )library ('clusterProfiler' )all_gene<-filter(data,color!='nonsignificant' ) gene_list <- all_gene$gene gene.df <- bitr(gene_list,fromType = "SYMBOL" , toType = c('ENSEMBL' ,'ENTREZID' ), OrgDb = org.Hs.eg.db) ego_cc <- enrichGO(gene=gene.df$ENSEMBL, OrgDb = org.Hs.eg.db, keyType = 'ENSEMBL' , ont = 'CC' , pAdjustMethod = 'BH' , pvalueCutoff = 0.01 , qvalueCutoff = 0.05 ) barplot(ego_cc,showCategory=10 ,title = 'The GO_CC ecnrichment analysis of all DEGS' )+ scale_size(range = c(2 ,12 ))+scale_x_discrete(labels=function (ego_cc) str_wrap(ego_cc,width = 25 ))
2.kegg富集 1 2 3 4 5 6 enrich_kegg <- enrichKEGG(gene = gene.df$ENTREZID, organism = 'hsa' , pvalueCutoff = 0.01 ) head(enrich_kegg) barplot(enrich_kegg,showCategory=18 ,title = 'The KEGG ecnrichment analysis of all DEGS' )+ scale_size(range = c(2 ,12 ))+scale_x_discrete(labels=function (enrich_kegg) str_wrap(enrich_kegg,width = 25 ))
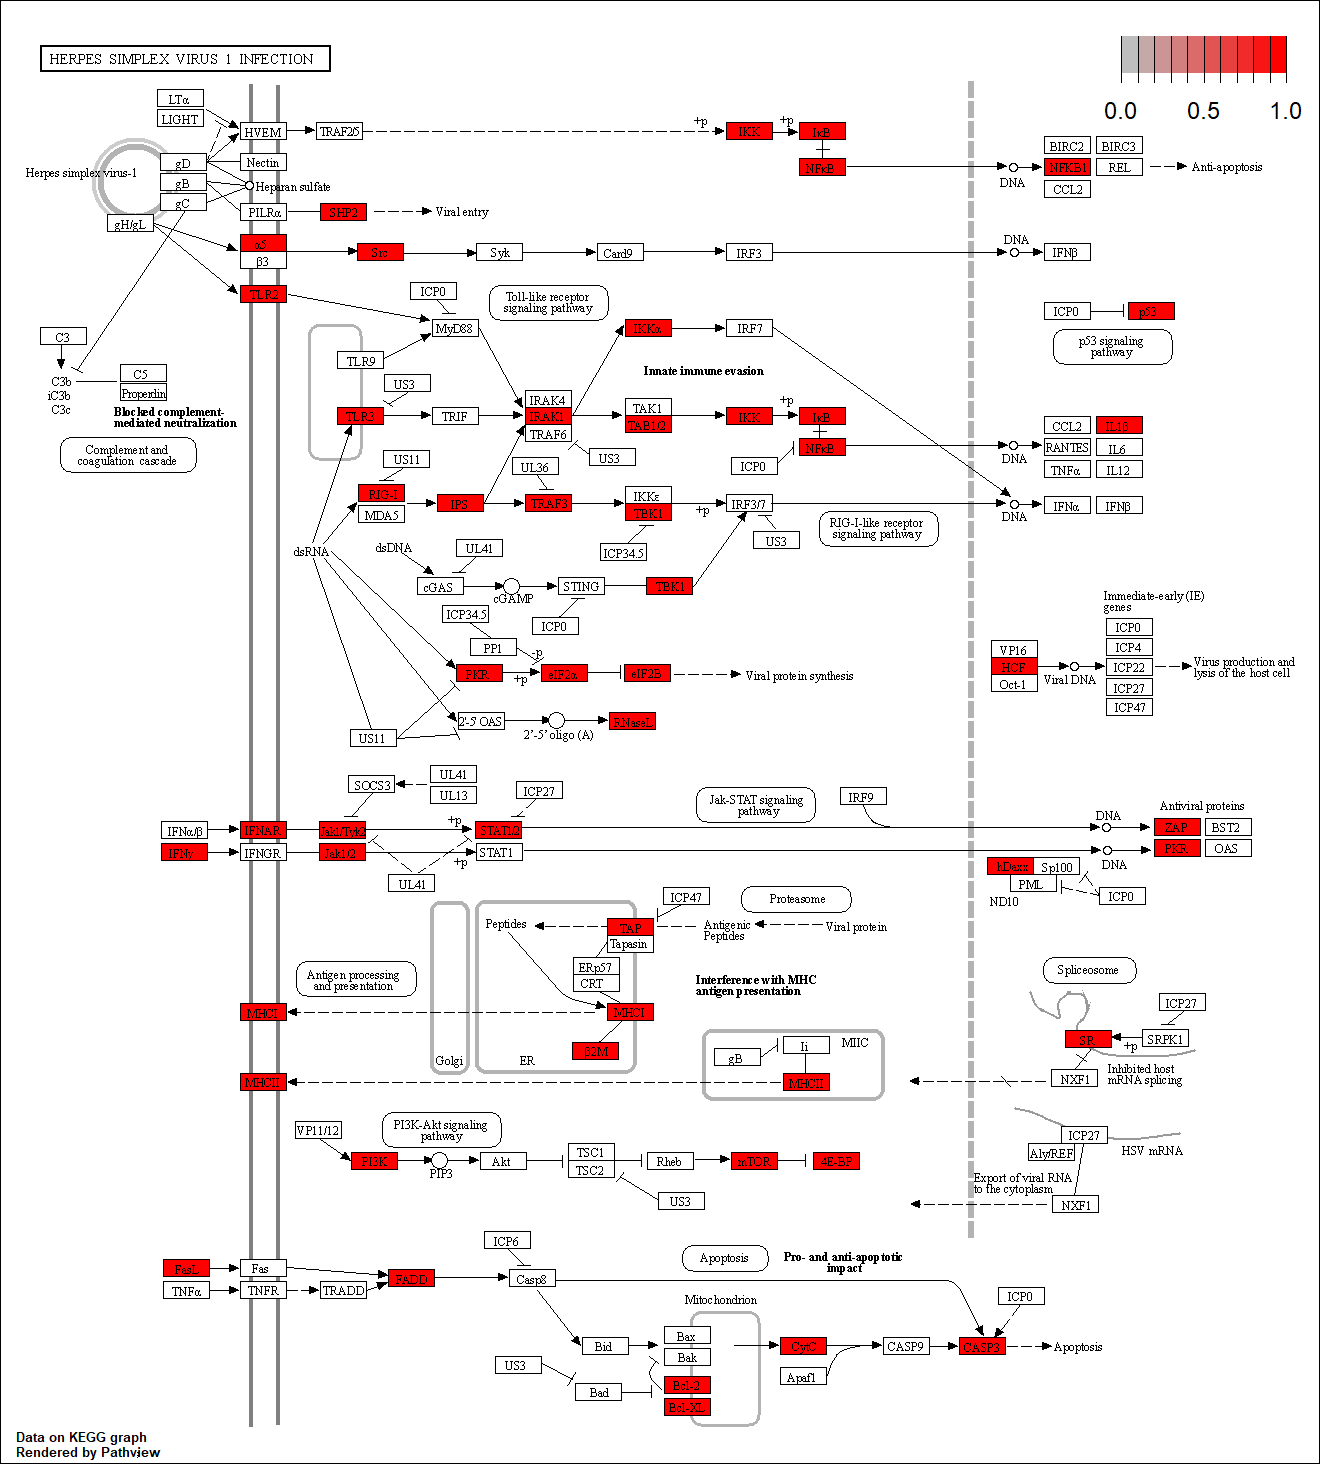
7.代谢通路图 1 2 3 4 5 6 7 8 9 10 11 12 13 14 15 16 17 18 19 20 21 head(gene.df) > head(gene.df) SYMBOL ENSEMBL ENTREZID 1 SLC35B4 ENSG00000205060 84912 2 TRA2B ENSG00000136527 6434 3 PLK2 ENSG00000145632 10769 4 ZC3HC1 ENSG00000091732 51530 5 ATP6V1B2 ENSG00000147416 526 7 CRYGS ENSG00000213139 1427 head(nrDEG) > head(nrDEG,2 ) logFC AveExpr t P.Value SLC35B4 1.011183 6.577433 18.05021 4.091992e-15 TRA2B -0.844217 9.327073 -13.30636 2.568722e-12 adj.P.Val B SLC35B4 9.553984e-11 23.67163 TRA2B 2.998727e-08 17.99524 nrDEG <- rownames_to_column(nrDEG,var='SYMBOL' ) path_gene <- merge(gene.df,nrDEG,by='SYMBOL' )%>%select('ENTREZID' ,'logFC' ) head(path_gene) pathview(path_gene[,1 ],species = 'hsa' ,pathway.id = "05168" )
8.PCA主成分分析 1.数据准备 1 2 3 4 5 6 7 8 9 10 11 12 13 14 15 16 17 18 19 20 21 22 23 24 25 26 27 28 29 > library (PCAtools) > sample_Info <- pData(gset[[1 ]])%>%select(geo_accession,title) > head(sample_Info,2 ) geo_accession title GSM1200291 GSM1200291 Gastric Cancer PBMC Sample 1 GSM1200292 GSM1200292 Gastric Cancer PBMC Sample 2 > group<-c(rep('GastricCancer' ,3 ),rep('HCC' ,10 ),rep('Normal' ,10 ),rep('PancreaticCancer' ,3 )) > head(group) [1 ] "GastricCancer" "GastricCancer" "GastricCancer" "HCC" "HCC" [6 ] "HCC" > sample_info2 <- mutate(sample_Info,group=group)%>%column_to_rownames(var='geo_accession' ) > head(sample_info2,2 ) title group GSM1200291 Gastric Cancer PBMC Sample 1 GastricCancer GSM1200292 Gastric Cancer PBMC Sample 2 GastricCancer > head(data4,2 ) GSM1200291 GSM1200292 GSM1200293 GSM1200294 GSM1200295 GSM1200296 GSM1200297 A1BG 1.72795 1.81743 1.67529 1.38177 1.76341 1.97542 1.96151 A1BG-AS1 4.24838 3.50769 3.55429 3.46720 3.54705 3.58128 3.47917 GSM1200298 GSM1200299 GSM1200300 GSM1200301 GSM1200302 GSM1200303 GSM1200304 A1BG 1.74726 1.80558 1.76479 1.74251 1.81299 1.77776 1.82972 A1BG-AS1 3.48404 3.59214 3.98491 2.68899 3.64721 3.59368 3.62686 GSM1200305 GSM1200306 GSM1200307 GSM1200308 GSM1200309 GSM1200310 GSM1200311 A1BG 1.71970 1.88509 1.73987 1.85889 2.05378 1.78240 1.78599 A1BG-AS1 3.66756 3.51368 3.60384 3.59204 3.60900 3.58077 3.55626 GSM1200312 GSM1200313 GSM1200314 GSM1200315 GSM1200316 A1BG 2.13868 1.7948 1.97225 1.63177 1.97266 A1BG-AS1 3.63223 3.5382 3.78817 3.47991 3.50805
2.PCA分析 1 2 3 4 5 6 7 8 9 10 11 12 13 14 > pca <- pca(data4,metadata = sample_info2)#data4的列名须与metadata的行名一致 > #提取loading信息 > pca_loadings <- pca$loadings > pca_loadings[1:2,1:4] PC1 PC2 PC3 PC4 A1BG 5.655176e-05 -0.0024044512 -0.0004510986 0.002296557 A1BG-AS1 -3.321379e-03 -0.0007576866 0.0031158285 -0.003570854 > #提取rotated信息 > pca_rotated <- pca$rotated > pca_rotated[1:2,1:4] PC1 PC2 PC3 PC4 GSM1200291 -208.501028 33.22847 -2.99058 0.2273477 GSM1200292 -9.333901 -38.77063 30.95839 -10.1408383
3.可视化 1 2 3 4 5 6 biplot(pca, x='PC1', y='PC2', colby = 'group', legendPosition = 'right', lab=NULL)
引用 1.又来问GEO差异表达?(1)
2.GEO 数据介绍及在线下载
