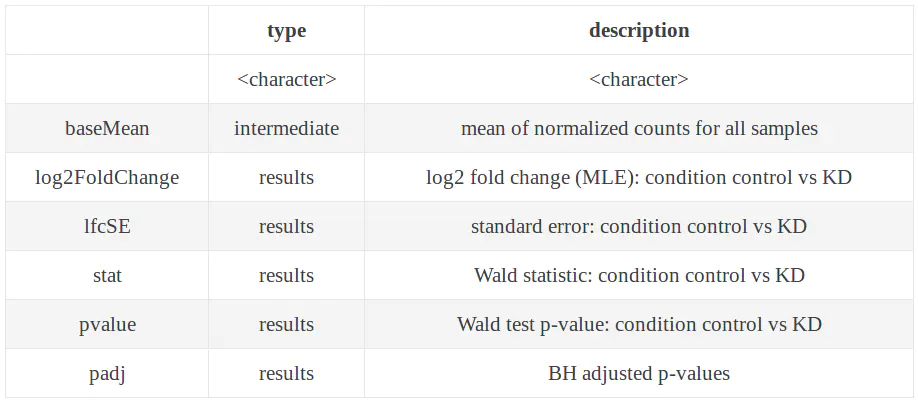
一.DESeq2筛选差异表达基因
a.使用DESeq2的两点要求:
- DEseq2要求输入数据是由整数组成的矩阵。
- DESeq2要求矩阵是没有标准化的。
b.DESeq2进行差异表达分析
DESeq2包分析差异表达基因简单来说只有三步:构建dds矩阵,标准化,以及进行差异分析。
1.构建dds矩阵
表达矩阵:\即上述代码中的countData,就是我们前面通过read count计算后并融合生成的矩阵,行为各个基因,列为各个样品,中间为计算reads或者fragment得到的整数。
样品信息矩阵:\即上述代码中的colData,它的类型是一个dataframe(数据框),第一列是样品名称,第二列是样品的处理情况(对照还是处理等),即condition,condition的类型是一个factor。
差异比较矩阵:\ 即上述代码中的design。 差异比较矩阵就是告诉差异分析函数是要从要分析哪些变量间的差异,简单说就是说明哪些是对照哪些是处理。
1
2
3
4
5
6
7
8
9
10
11
12
13
14
15
16
17
18
19
20
21
22
23
24
25
26
27
28
29
30
31
32
33
| > countData <- read.csv('readcount.csv',header = TRUE,row.names = 1)
> head(countData)
control1 control2 treat1 treat2
ENSG00000000003 796 349 780 937
ENSG00000000005 0 0 0 1
ENSG00000000419 389 174 403 503
ENSG00000000457 288 108 218 283
ENSG00000000460 506 208 451 543
ENSG00000000938 0 0 0 0
> condition <- factor(c(rep('control',2),rep('treat',2)),levels=c('control','treat'))
> condition
[1] control control treat treat
Levels: control treat
> colData <- data.frame(row.names = colnames(countData),condition)
> colData
condition
control1 control
control2 control
treat1 treat
treat2 treat
> dds <- DESeqDataSetFromMatrix(countData, colData, design= ~ condition)
> head(dds)
class: DESeqDataSet
dim: 6 4
metadata(1): version
assays(1): counts
rownames(6): ENSG00000000003 ENSG00000000005 ... ENSG00000000460
ENSG00000000938
rowData names(0):
colnames(4): control1 control2 treat1 treat2
colData names(1): condition
|
2.DESeq标准化dds
1
2
3
4
5
6
7
8
9
10
11
12
13
14
15
16
17
18
19
20
21
22
23
24
25
26
27
28
29
30
31
32
33
34
35
36
37
38
39
40
41
| > dds_nrom <- DESeq(dds)
estimating size factors
estimating dispersions
gene-wise dispersion estimates
mean-dispersion relationship
final dispersion estimates
fitting model and testing
> dds_nrom
class: DESeqDataSet
dim: 57820 4
metadata(1): version
assays(4): counts mu H cooks
rownames(57820): ENSG00000000003 ENSG00000000005 ...
ENSGR0000266731 ENSGR0000270726
rowData names(22): baseMean baseVar ... deviance maxCooks
colnames(4): control1 control2 treat1 treat2
colData names(2): condition sizeFactor
> resultsNames(dds_nrom)
[1] "Intercept" "condition_treat_vs_control"
> res <- results(dds_nrom,contrast = c('condition','control','treat'))
> head(res)
log2 fold change (MLE): condition control vs treat
Wald test p-value: condition control vs treat
DataFrame with 6 rows and 6 columns
baseMean log2FoldChange lfcSE stat pvalue
<numeric> <numeric> <numeric> <numeric> <numeric>
ENSG00000000003 664.272867 0.0532281 0.189912 0.280278 0.779264
ENSG00000000005 0.173561 -0.6527476 4.990679 -0.130793 0.895939
ENSG00000000419 338.705598 -0.0418097 0.218144 -0.191661 0.848008
ENSG00000000457 208.240952 0.2670211 0.252043 1.059425 0.289406
ENSG00000000460 396.971168 0.1448093 0.209989 0.689605 0.490442
ENSG00000000938 0.000000 NA NA NA NA
padj
<numeric>
ENSG00000000003 0.914425
ENSG00000000005 NA
ENSG00000000419 0.947707
ENSG00000000457 0.620808
ENSG00000000460 0.764178
ENSG00000000938 NA
|
3.提取差异分析结果
1
2
3
4
5
6
7
8
9
10
11
12
13
14
15
16
17
18
19
20
21
22
23
24
25
26
27
28
29
30
31
32
33
34
| > table(res$padj<0.05)
FALSE TRUE
13660 85
> diff_gene_deseq2 <- subset(res,padj<0.05 & (log2FoldChange<-1 | log2FoldChange>1))
> diff_gene_deseq2 <- diff_gene_deseq2[order(diff_gene_deseq2$padj),]
> head(diff_gene_deseq2)
DataFrame with 6 rows and 6 columns
baseMean log2FoldChange lfcSE stat pvalue
<numeric> <numeric> <numeric> <numeric> <numeric>
ENSG00000178691 531.592 2.899835 0.236065 12.28407 1.10308e-34
ENSG00000135535 1195.269 1.236055 0.197024 6.27364 3.52700e-10
ENSG00000196504 1798.248 1.124007 0.202337 5.55513 2.77404e-08
ENSG00000141425 1290.172 0.970386 0.179053 5.41955 5.97506e-08
ENSG00000164172 256.882 1.281828 0.242745 5.28056 1.28788e-07
ENSG00000173905 551.603 1.180928 0.225624 5.23404 1.65840e-07
padj
<numeric>
ENSG00000178691 9.16436e-31
ENSG00000135535 1.46512e-06
ENSG00000196504 7.68224e-05
ENSG00000141425 1.24102e-04
ENSG00000164172 2.13994e-04
ENSG00000173905 2.29634e-04
> summary(res)
out of 29434 with nonzero total read count
adjusted p-value < 0.1
LFC > 0 (up) : 42, 0.14%
LFC < 0 (down) : 8, 0.027%
outliers [1] : 0, 0%
low counts [2] : 21126, 72%
(mean count < 137)
[1] see 'cooksCutoff' argument of ?results
[2] see 'independentFiltering' argument of ?results
|

二.用biomart对差异表达基因进行注释
bioMart包是一个连接bioMart数据库的R语言接口,能通过这个软件包自由连接到bioMart数据库
这个·包可以做以下几个工作
1.查找某个基因在染色体上的位置。反之,给定染色体每一区间,返回该区间的基因s;
2.通过EntrezGene的ID查找到相关序列的GO注释。反之,给定相关的GO注释,获取相关的EntrezGene的ID;
3.通过EntrezGene的ID查找到相关序列的上游100bp序列(可能包含启动子等调控元件);
4.查找人类染色体上每一段区域中已知的SNPs;
5.给定一组的序列ID,获得其中具体的序列;
1
2
3
4
5
6
7
8
9
10
11
12
13
14
15
16
17
18
19
20
21
22
23
24
25
26
27
28
29
30
31
32
33
34
35
36
37
38
39
40
41
42
43
44
45
46
47
48
49
50
51
52
53
54
55
56
57
58
59
60
61
62
63
64
65
66
67
68
69
70
71
72
73
74
|
mart <- useDataset("hsapiens_gene_ensembl", useMart("ensembl"))
> my_ensembl_gene_id <- rownames(diff_gene_deseq2)
> head(my_ensembl_gene_id)
[1] "ENSG00000178691" "ENSG00000135535" "ENSG00000196504"
[4] "ENSG00000141425" "ENSG00000164172" "ENSG00000173905"
> hg_symbols<- getBM(attributes=c('ensembl_gene_id','hgnc_symbol',"chromosome_name", "start_position","end_position", "band"), filters= 'ensembl_gene_id', values = my_ensembl_gene_id, mart = mart)
> head(hg_symbols)
ensembl_gene_id hgnc_symbol chromosome_name start_position end_position
1 ENSG00000039319 ZFYVE16 5 80408013 80483379
2 ENSG00000054598 FOXC1 6 1609915 1613897
3 ENSG00000064666 CNN2 19 1026586 1039068
4 ENSG00000071794 HLTF 3 149030127 149086554
5 ENSG00000075624 ACTB 7 5526409 5563902
6 ENSG00000077549 CAPZB 1 19338775 19485539
band
1 q14.1
2 p25.3
3 p13.3
4 q24
5 p22.1
6 p36.13
> diff_gene_deseq2$ensembl_gene_id <- rownames(diff_gene_deseq2)
> head(diff_gene_deseq2)
log2 fold change (MLE): condition control vs treat
Wald test p-value: condition control vs treat
DataFrame with 6 rows and 7 columns
baseMean log2FoldChange lfcSE stat pvalue
<numeric> <numeric> <numeric> <numeric> <numeric>
ENSG00000178691 531.592 2.899835 0.236065 12.28407 1.10308e-34
ENSG00000135535 1195.269 1.236055 0.197024 6.27364 3.52700e-10
ENSG00000196504 1798.248 1.124007 0.202337 5.55513 2.77404e-08
ENSG00000141425 1290.172 0.970386 0.179053 5.41955 5.97506e-08
ENSG00000164172 256.882 1.281828 0.242745 5.28056 1.28788e-07
ENSG00000173905 551.603 1.180928 0.225624 5.23404 1.65840e-07
padj ensembl_gene_id
<numeric> <character>
ENSG00000178691 9.16436e-31 ENSG00000178691
ENSG00000135535 1.46512e-06 ENSG00000135535
ENSG00000196504 7.68224e-05 ENSG00000196504
ENSG00000141425 1.24102e-04 ENSG00000141425
ENSG00000164172 2.13994e-04 ENSG00000164172
ENSG00000173905 2.29634e-04 ENSG00000173905
> diff_name <- merge(diff_gene_deseq2,hg_symbols,by="ensembl_gene_id")
Error in as(merge(as(x, "data.frame"), y, ...), class(x)) :
no method or default for coercing “data.frame” to “DESeqResults”
> diff_name <- merge(as.data.frame(diff_gene_deseq2),hg_symbols,by="ensembl_gene_id")
> head(diff_name)
ensembl_gene_id baseMean log2FoldChange lfcSE stat
1 ENSG00000039319 522.7108 0.9650973 0.2447603 3.943030
2 ENSG00000054598 1253.0761 0.7833167 0.1776648 4.408959
3 ENSG00000064666 233.3811 -1.0576105 0.2623787 -4.030855
4 ENSG00000071794 1030.8820 0.9222084 0.2203282 4.185612
5 ENSG00000075624 7955.8749 -0.6617466 0.1679916 -3.939165
6 ENSG00000077549 598.6919 0.8949043 0.2002158 4.469698
pvalue padj hgnc_symbol chromosome_name start_position
1 8.045870e-05 0.028304572 ZFYVE16 5 80408013
2 1.038687e-05 0.005393382 FOXC1 6 1609915
3 5.557431e-05 0.020986881 CNN2 19 1026586
4 2.843993e-05 0.012501549 HLTF 3 149030127
5 8.176573e-05 0.028304572 ACTB 7 5526409
6 7.833019e-06 0.004419020 CAPZB 1 19338775
end_position band
1 80483379 q14.1
2 1613897 p25.3
3 1039068 p13.3
4 149086554 q24
5 5563902 p22.1
6 19485539 p36.13
|
引用
1.第二次RNA-seq实战总结(3)-用DESeq2进行基因表达差异分析
2.RNA-seq练习 第三部分(DEseq2筛选差异表达基因,可视化)


